


Map 1. Overview
While anyone can experience abuse, not everyone can access the resources and support they need to be, get, and stay safe. Survivors from oppressed communities are disproportionately impacted by domestic violence due to policies and systems that impede their access to resources and safety.
The purpose of Map 1 is to provide state-level demographic and violence data to help you tell the story of:
- Your state’s culture and diversity
- What safety may require for different communities
- Who disproportionately experiences violence (or where gaps in data lie)
- What’s needed from programs, partnerships, and policy to reach and support those most impacted
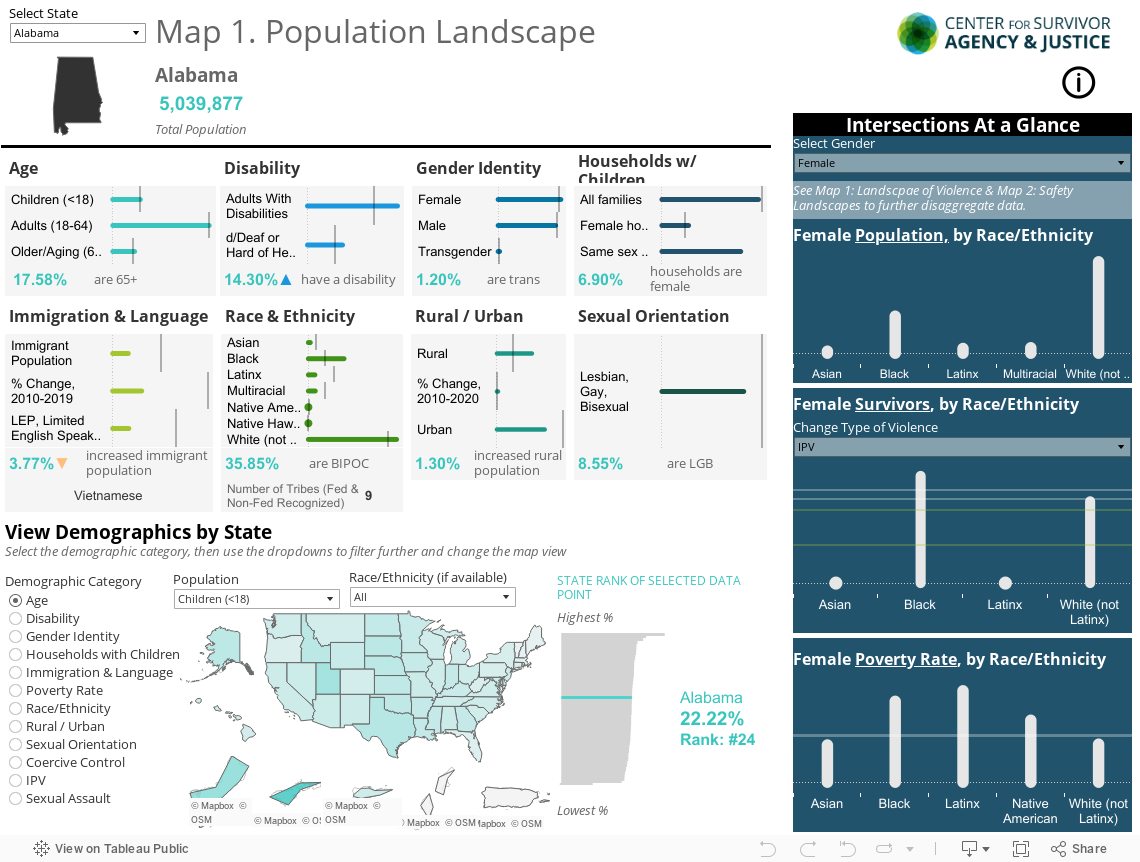
Population Landscape Dashboard
Note: Dashboards are best viewed on a desktop or laptop computer. The layout and functionality will get distorted on cell phone screens.
Each of us identifies as many things and may belong to multiple communities; a racial or ethnic group, rural or urban, based on work, religion, language, etc. This can shape what safety looks like and requires. Use this dashboard to take a step back and explore the general demographic make-up and diversity of your state, and begin to identify which populations face disproportionate barriers to safety.
View Methodology & Documentation Doc.
- What’s the population make-up in my state? Which groups are predominant? Which populations are changing or surprising?
- What regional or local population differences are not reflected here, but important to understanding my state? What populations am I curious to learn more about?
- What populations do I or my organization serve or primarily serve? Who are we not reaching?
- Of potentially underserved populations I can identify, what are their safety needs? And are we meeting them?
-
- Select your State or Territory from the dropdown in the top left.
- The bar charts help you compare demographics of your state (blue/teal lines) compared to the national average (gray bar). Hover over the data for “pop-ups” with additional details.
- Use the dropdown above the map on the right to view demographic data in the map. You can compare and find commonalities across states. Hover for a “pop-up” with details.
- Click the ‘download’ icon in the bottom-right to download a PDF, image, or PowerPoint slide of the dashboard. Make sure you’ve selected the state and data point for the map you want, first. Bring this to meetings, share with partners, add your own data to supplement, or otherwise use it in your advocacy!
- Click here for additional research and other resources that may help fill gaps in data and offer models of data you may have, can collect, and ways to put it together for advocacy.
Other Resources: Population Demographics
Want to explore other demographic data? Or do you need demographic data at the county or zipcode level? These additional resources are not meant to be exhaustive, but fill some data gaps, demonstrate how data can be compiled and used in advocacy efforts, and spur your curiosity to explore further, based on your needs.
-
2020 Census Demographic Map Zoom-in on the map for county and census tract level data as you zoom in). Also see other Interactive Census Maps
-
Household Pulse Survey By the U.S. Census has data tables on expanded population demographics and across important economic and social factors, like childcare costs.
-
Connecticut’s Data Collaborative An example of state-specific data tables and other visualizations. Does your state have similar tools?
-
UCLA’s LGBT Data & Demographics Select demographic and socioeconomic data on the LGBT population in each state.
-
Demographics Dashboard on US Native Lands Select the Native Land/Tribal Nation to view additional demographics. By the Native Land Information System
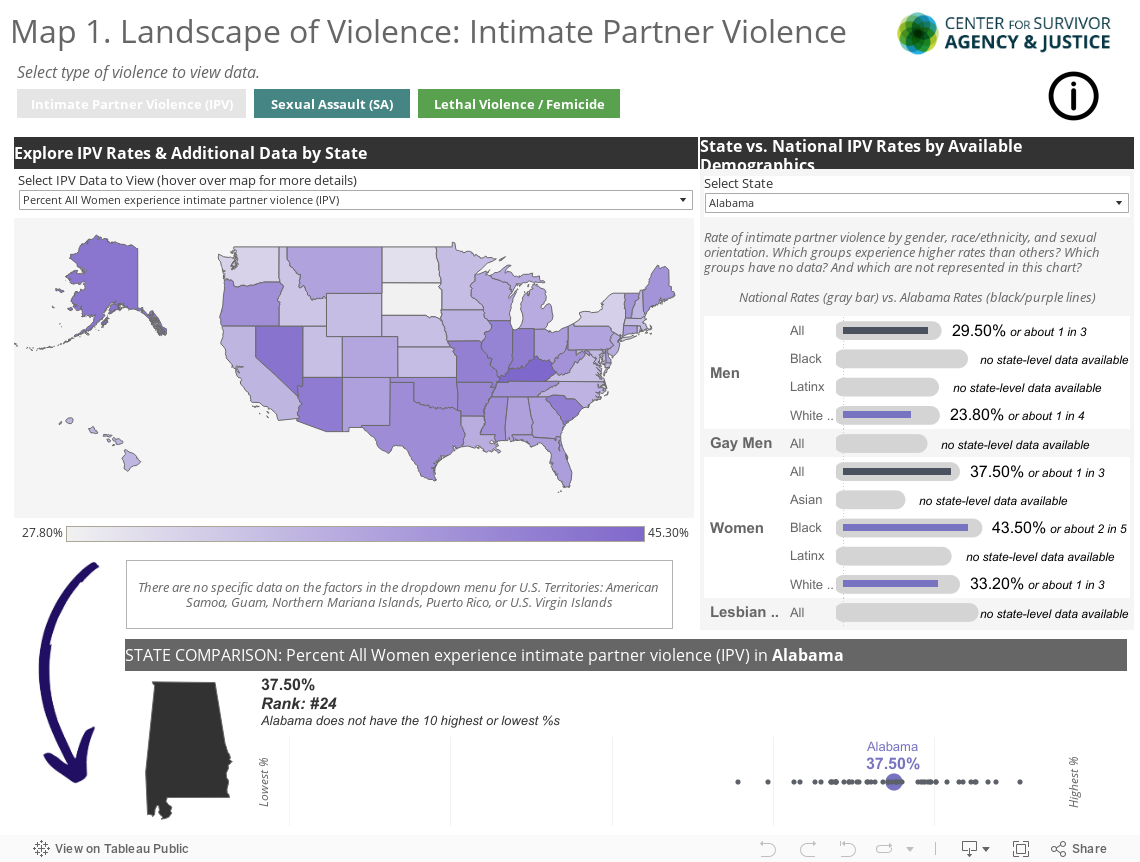
Landscape of Violence Dashboard
Note: Dashboards are best viewed on a desktop or laptop computer. The layout and functionality may distort to fit smart-phone screens.
While 1 in 3 of all women in the U.S. experience domestic violence, in some states that rate is much higher, and higher still amongst Black and Latinx women (nearly 1 in 2, in some cases). Use this dashboard to explore rates of domestic violence, sexual violence, and femicide across race/ethnicity and other demographic factors.
- Who experiences domestic, sexual, femicide, or other gender-based violence in my state?
- Who is most or disproportionately impacted?
- Where data is limited, where can I go, who can I talk to, or what can I do to map a fuller or more nuanced landscape of violence in my state?
- Who are you serving or who do you primarily serve? Does that match the needs you see represented in the data? Who might be underserved in your state?
- Do you serve communities not reflected in the dashboard? What does your program data or other understanding of need add to the understanding of the landscape? (Look back at the Population Landscape dashboard to see which populations are prevalent in your state but have little/no national data.)
-
- Select your State or Territory from the dropdown in the top left.
- Select the buttons at the top to view data specific to domestic violence, sexual violence, or severe violence.
- The bar charts help you compare rates of violence by race and other demographics in your state compared to national rates. Hover over the data for “pop-ups” with additional details.
- Use the dropdown above the map on the right to view rates and other statistics on violence in the map. You can compare and find commonalities across states. Hover for a “pop-up” with details.
- Click the ‘download’ icon in the bottom-right to download a PDF, image, or PowerPoint slide of the dashboard. Make sure you’ve selected the state and data point for the map you want, first. Bring this to meetings, share with partners, add your own data to supplement, or otherwise use it in your advocacy!
- Click here for additional research and other resources that may help fill gaps in data.
Other Resources: Population-Specific Data on Gender-Based Violence
There is not a lot of state-level data on the prevalence of intimate-partner or other forms of gender-based violence, especially across race and other identity factors. Program and service reports can be helpful to understanding who you are reaching, but may not be representative of all who experience abuse due to barriers accessing formal service or even advocacy programs. These additional resources are not state-specific nor meant to be exhaustive, but to fill some data gaps, and serve examples of data you may have (or could collect), including how it can be compiled and used in advocacy efforts. And they are meant to spur your curiosity to explore further.
-
National Findings of Victimization by Sexual Orientation (2010) from the National Intimate Partner & Sexual Violence Survey
-
LGBTQ & HIV Affected Hate & Intimate Partner Violence in 2017 By the National Coalition of Anti-Violence Programs (based on 825 reports of hate violence in 10 states and 2,144 reports of IPV in 11 states)
-
Missing & Murdered Indigenous Women & Girl (2017) Report on 506 MMIW cases in 71 cities, by Urban Indian Health Institute
-
Wisconsin MMIW Taskforce: State Strategic Plan & Toolkit State-specific example of data/story gathering and action-planning. Do similar initiatives exist in your state?
-
California: Sovereign Bodies Institute Reports A database to request MMIWG data (Be mindful of Tribal and data sovereignty when reaching out or using data)
-
CDC 2003-2014 Report on Racial Differences in IPV-Related Homicides (national data).
-
National Coalition Against Domestic Violence State factsheets on DV, including firearms and homicide data
-
Law Enforcement Experience Report (2021) A national survey of survivors’ interactions with law enforcement, by the National Domestic Violence Hotline
SEED-ing Advocacy
Click the links below to craft stories to fuel your advocacy & share your work, data, and recommendations with others. First, consider:
- What data stands out to you?
- How can this data be useful?
- What other data do you have to supplement what you see here? What else do you need?
- How can this data support your advocacy? Or how can your past advocacy efforts, insights, and lessons learned help others and improve the dashboard?
Use the prompts below to practice using dashboard data to craft and submit stories and ideas for systems change. You can also request assistance from CSAJ.
Use the prompts below to share your advocacy stories and best-practices with us. We’ll anonymize and add these as “map layers” in the dashboards in the future so the entire field can benefit. You can also request assistance from CSAJ.
Created by: Sara Wee
This project is supported by the Allstate Foundation
